Friday, 3 May 2024
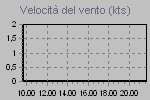
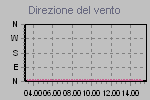
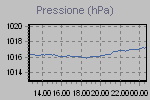
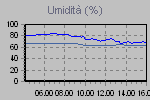
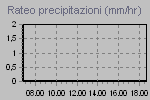
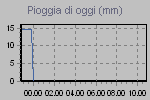
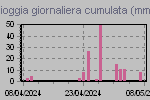
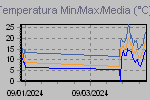
These graphs present temperature, pressure, rainfall, and wind speed trends for the last 12 hours
The thumbnail graphs are sampled every 5 minutes
Click on a thumbnail to display the corresponding larger graph
Last update: 03/05/2024 7.45.01powered by Cumulus 1.9.4 (1099)